
Reading Time:
Overview
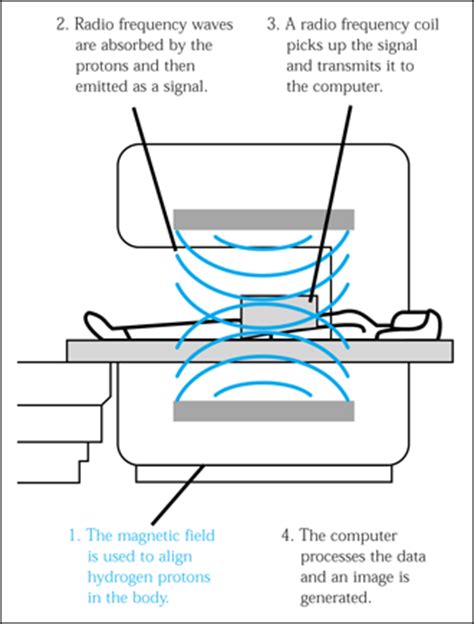
Magnetic resonance imaging (MRI) provides images of the body similar to those of CT scans, but MRI is better for tissue differentiation. MRI studies closely resemble anatomical sections. The person is placed in a scanner with a strong magnetic field.
MRI scans work as an imaging method as the body is comprised entirely of cells which all contain water – principally made of hydrogen ions (H2O). The magnet embedded within the MRI scanner can act on these positively charged hydrogen ions (H+ ions) and cause them to ‘spin’ in an identical manner. By varying the strength and direction of this magnetic field, MRI can change the direction of ‘spin’ of the protons, enabling us to build layers of detail. Free protons in the tissues that become aligned by the surrounding magnetic field.
As the protons spin back as the magnetic field is switched off they lose/emit energy which can be measured, returning to their original state in a process known as precession.
Tissues that are high in proton density, such as fat and water, emit more signals than tissues that are low in proton density. The tissue signal is based primarily on three properties of protons in a particular region of the body. These are referred to as T1 and T2 (producing T1- and T2-weighted images). Although liquids have a high density of free protons, the excited free protons in moving fluids such as blood tend to move out of the field before they flip and give off their signal and are replaced by unexcited protons. Consequently, moving fluids appear black in T1-weighted images.
Key Images
Key Info
MRI scans, much like computed tomography, typically produce three anatomical views; sagittal, coronal and axial (similar to the planes of the body). When interpreting axial views, it is important to appreciate that the image is viewed from the feet upwards – and so the left-hand side of the image refers to the patient’s right (and vice versa).
Clinical Anatomy
Cauda Equina Syndrome
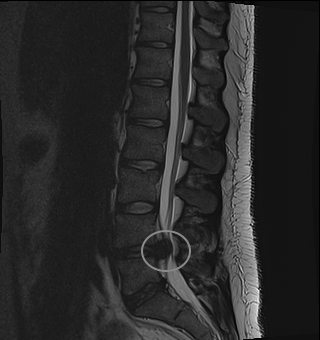
MRI is key in fast diagnosis of the emergency condition caudal equine syndrome. It is also used to assess the extent of cord compression, when there is a suspicion of stenosis or disc herniation.
The figure below shows a T2 weighted, sagittal MRI of the lumbar spine. The thecal sac is easily visible as the 1cm thick white band running posterior to the vertebral bodies. This is interupted at the L4/L5 level by a small round dark area, which is the herniation of the intervertebral disc into the central canal.
Summary
It can help to remember that a T tWo weighted image shows Water as White.
| Appearance | T1 Weighted Image | T2 Weighted Image |
| White | Fat Protein Rich Fluid | Water Content E.g. Inflammation, Tumour, Haemorrhage, Infection |
| Intermediate | Gray Spinal Matter darker than White | White Spinal matter darker than gray spinal matter. |
| Dark | Bone Air Water Content e.g. Inflamation, Tumour, Haemorrhage | Bone Air Fat |